
by Kate Evert | Apr 12, 2018 | Compensation, Diversity, Equity, Inclusion, Salary Budgets, Wage Increases, Work Place
I had no hesitation about becoming a working mother. But reading this article brought back a memory that I must have blocked – until now.
Just about 21 years ago, when awaiting the birth of our first child, I encountered a female partner at the elevator bank. Now given that the Partner-in-Charge of our National group practice was a mother, the Partner-in-Charge of our Chicago practice was a mother, and I had two supportive bosses who were both fathers, I was not unduly worried about becoming a working mother.
Imagine my surprise when this female partner asked me how was I going to “manage coming back to work” after the birth of my child? I thought it was the oddest of questions to ask in our practice area, but despite my surprise, answered her anyway. So imagine my shock when she responded, “Well I sure hope your husband makes a lot of money; that will be expensive.” Now given that we worked in Global Human Resources Solutions, this response was so wrong on so many levels. But even way back in 1997, I found the notion that my career plans were going to be entirely dependent on the earning power of my husband completely absurd.
Sadly, this article shows that perhaps that notion wasn’t so absurd. Our daughter turns 21 this month. I just hope and pray that this notion changes in time for her. Read More Here
by Kate Evert | Mar 8, 2018 | Compensation, Economy, Wage Increases
“Will I get a raise? How much?” is a question on everyone’s mind at this time of year.
Since January, the press has been full of stories telling everyone to only expect a 3% raise. Well, compensation consultants hate generalities almost as much as statisticians do.
There is a reason that Commonwealth HR Consulting keeps a link to the Atlanta Fed front and center on our resource page. Not only do we think that the Atlanta Fed gets it (using a methodology developed by the San Francisco Fed), but we think this is a wonderful resource for organizations to reference based upon your location(s), labor market(s), and labor force(s).
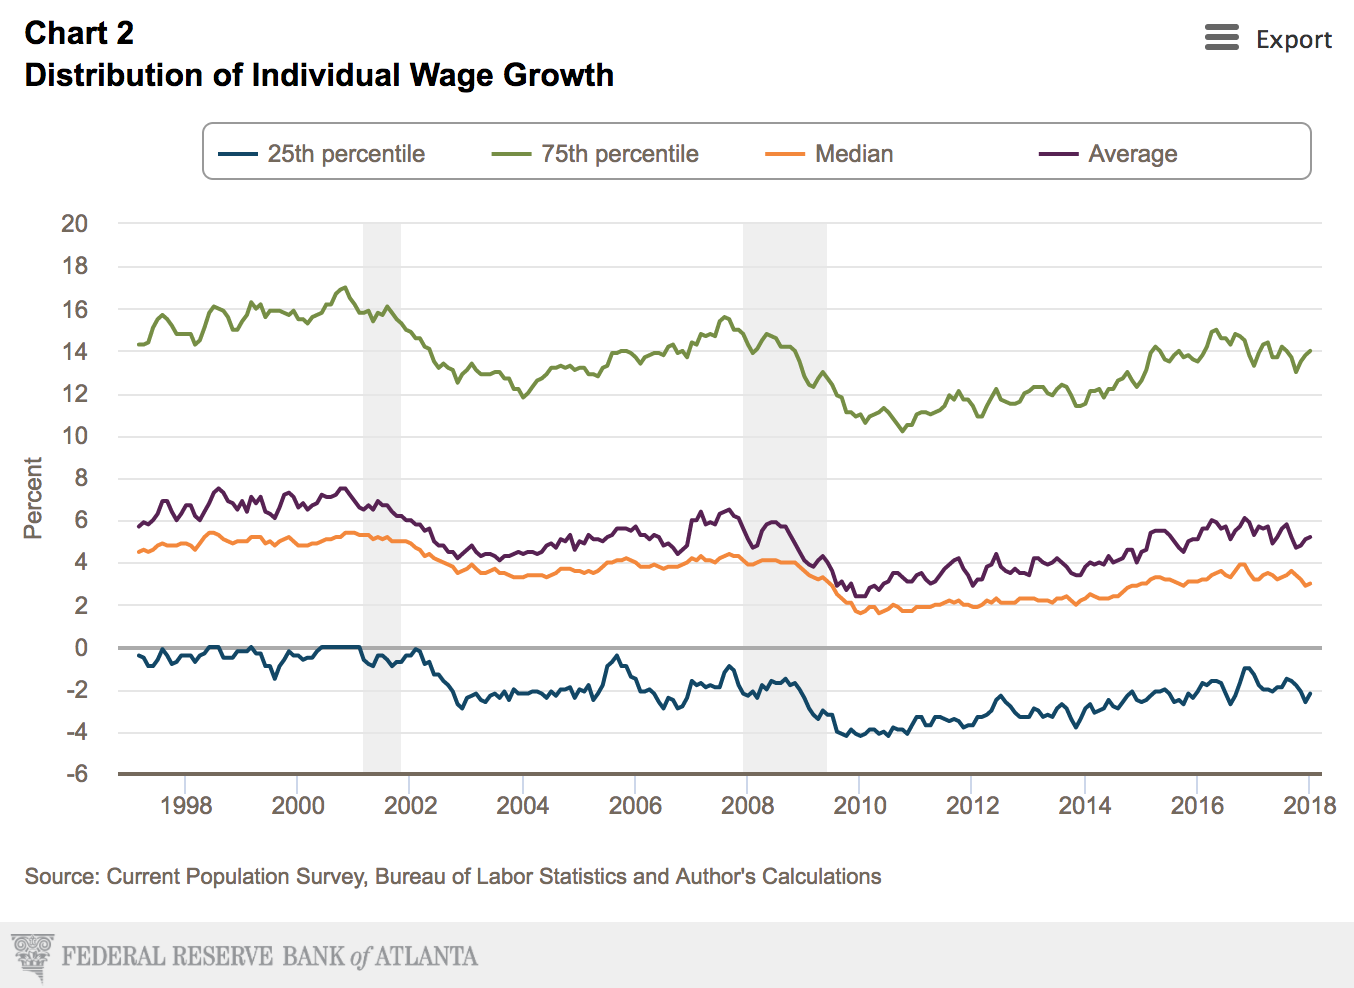
As for that 3.0% increase? We urge you to take a look at Charts 2 and 3 at the Atlanta Fed’s site. In January, the Distribution of Individual Wage Growth showed:
25th Percentile = -2.2%
50th Percentile/Median = 3.0%
Average = 5.2%
75th Percentile = 14.0%
Chart 3 indicates that 14.9% of the group that the Fed tracks, received a 0% increase.
Some food for thought. Especially if you are an employer who is consistently giving increases to employees who have not upgraded their skills in years … and at the same pace as those employees who possess hot skills, the 14% hot skills. Read More Here

by Kate Evert | Nov 16, 2017 | Compensation, Economy, Wage Increases
[vc_row][vc_column][vc_column_text]
On their earnings call recently, Equifax announced that due to their recent cyber breach, the executive team would be foregoing any annual incentive this
year. Read More Here. “Well that’s good I thought. About time some executives owned up, felt the pain, …” But then this little voice in me wondered … how much pain are they really going to be feeling? Is this for real, or just a good story? So I did what any good compensation consultant would do:
I read their proxy.
It turns out that this noble act isn’t necessarily as noble as it first sounded. First, in their comp design, the target annual incentive comprises only 18% of the Target Pay Mix for the Named Executive Officers. Then, if the 2017 plan follows the design of the 2016 plan, 15% of the annual incentive plan is tied to Corporate Operating Revenue and 65% is tied to Corporate Adjusted EPS. Something tells me that the chances of Corporate Operating Revenue meeting expectations this year aren’t very good. And as for Corporate Adjusted EPS,
which they footnote is a non-GAAP financial measure, well why that is a questionable measure in an annual incentive plan is a blog for another day.
Read More Here.

by Kate Evert | May 17, 2017 | Compensation, Economy, Labor Markets, Wage Increases
For college seniors entering the work force this year after graduation, there’s a lot to look forward to: high employment rate, higher salaries. The future is bright. Or is it? Others have a more pessimistic outlook. They paint a dimmer picture for this next generation: slow wage growth, and more inequality.
You might be left scratching your head with all the conflicting sources. Here’s what’s really going on: the data doesn’t lie, but it doesn’t give a full picture of what’s happening. That’s why compensation consultants are using more specific data, considering factors like industry, location, and demographic.
To read more of the positive, HERE or HERE or more of the negative HERE or HERE, but proceed with caution.

by Kate Evert | Feb 1, 2017 | Compensation, Economy, Labor Markets, Salary Budgets, Wage Increases
I am sure we sound like a broken record when it comes to AVERAGE wage growth. We’ve pointed out that as Baby Boomers retire at high salaries, and young people enter the labor market at low salaries, of course the average will be lower. We’ve worried that salary budgets of 3.0% meant to cover all range of employees – whether they are in “hot” geographical areas or possess scarce skills – leads to companies making poor merit increase decisions.
The Atlanta Fed has figured out a methodology of looking at wage growth that measures the growth of wages for those that stay in jobs, therefore measuring income growth for non-job changers. The Wage Growth Tracker is the time series of the median wage growth of matched individuals. This is not the same as growth in the median wage.
But Look at Charts 2 and 3. You may have learned in stats class that the median is important because it strips out the noise at the top and the bottom. But this time look at the noise! Follow the 25th and 75th percentiles in Chart 2 to see the tops and the bottoms. See that some workers are receiving 14% or 15% increases and ask yourself: do I have any employees that fit that profile? If I do – how can I address that? Then look at the 25th percentile and ask about what is happening with the negative increases? What competitive factors are driving that?
Lastly, drop to the bottom chart. That’s the percentage of workers receiving 0% increase. Another big why? Are companies diverting that small pool to the 14%? Is there a failure to invest in skills?
We do not have all the answers, but we hope we have framed the questions that folks should be asking. Read More Here

